Torque Converter Tech Tips
- Author: Ed Lee
Part 3 in a four-part series on torque-converter modifications
In parts 1 and 2 we looked at the results of chassis-dyno testing conducted on torque-converter modifications by Sean Boyle’s students in the automatic-transmission course at Southern Illinois University. The testing was done on an MD-250 Mustang chassis dyno, and the test vehicle was a stock 2000 Dodge Durango RT equipped with a 5.9-liter gas engine and a 46RE transmission.
Converter A had a stator modification that lowered the stall of the converter. The vehicle responded favorably to this modification and consistently outperformed the stock 144K-factor converter that was used for the baseline of the evaluations. There were also no negative trade-offs with the modifications done to converter A.
Converter B also had a stator modification, which raised the stall. The stock power plant of the test vehicle did not respond in a positive manner to this stator modification. The OEM converter consistently outperformed converter B throughout the dyno run, and converter B had a negative trade-off with increased temperature.
The next converter to be evaluated was converter C. Converter C retained the stock 144K-factor stator. The only modification to converter C was to the internal clearance. The 0.080-inch OEM clearance between the impeller and turbine was increased to 0.160 inch.
This modification is popular on performance converters to increase the stall. Since the wide-open-throttle horsepower test was the only one used for evaluation purposes, no measurable increase in stall could be seen with this modification. If you look at the overlay graph of the original converter vs. converter C in Figure 1 and the line-by-line comparison in Figure 2, you will notice some distinct differences. The torque and horsepower values started higher with the OEM converter and continued to climb up to 4,400 rpm. Both converters had their peak performance at the 3,800-rpm break, but the greatest difference in performance occurred at 3,000 rpm.
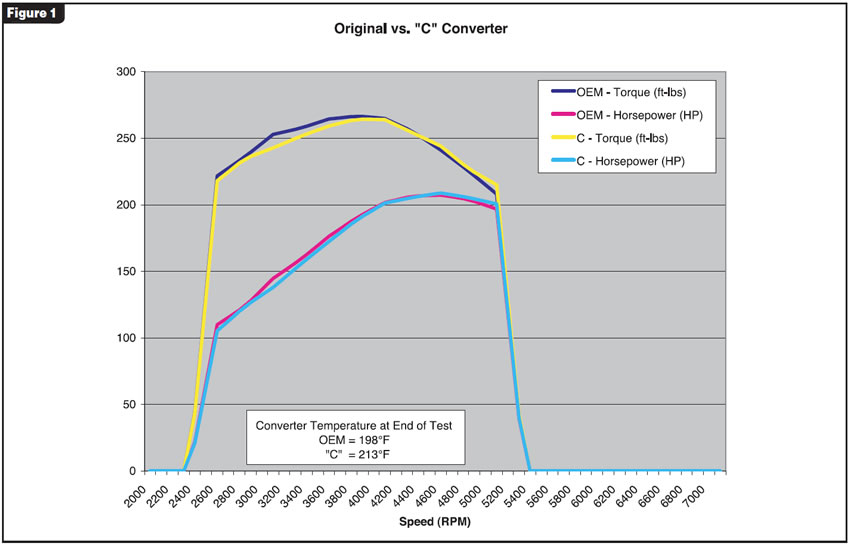
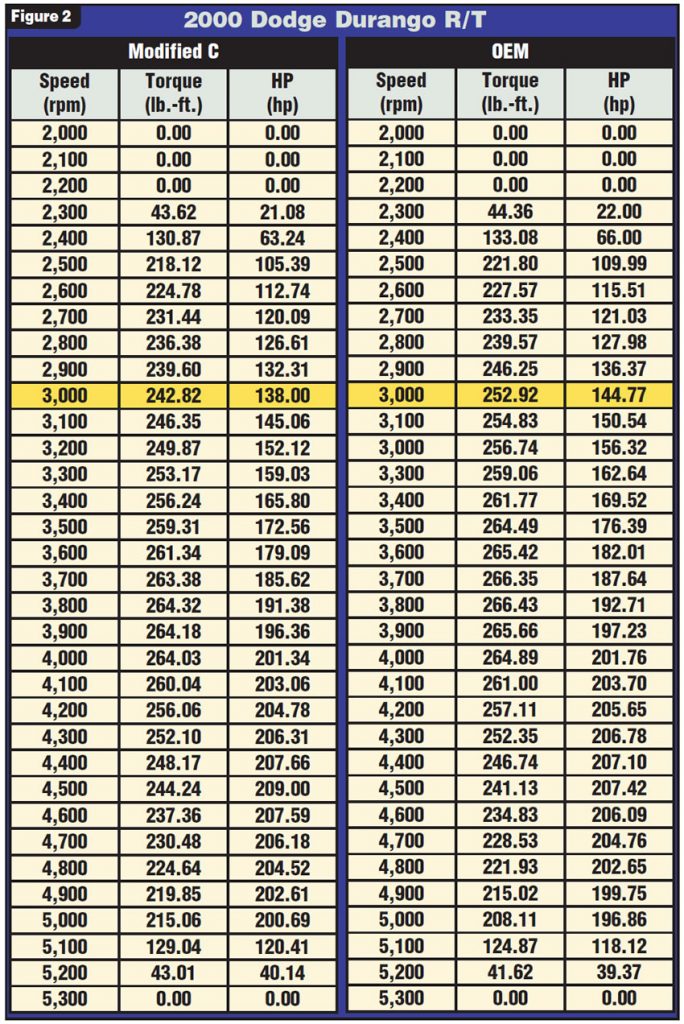
At 3,000 rpm the OEM converter outperformed the modified converter by 6 horsepower and 10 lb.-ft. of torque. The major difference in performance with converter C when compared with converters A and B is that its performance levels did not continue to parallel that of the OEM for the entire run.
Converter A had performance levels that were consistently higher than the OEM converter, and converter B had performance levels that were consistently lower than the OEM converter throughout the dyno runs.
Converter C started out with performance levels lower than those of the OEM converter, but at 4,400 rpm the performance levels reversed and converter C’s performance levels remained higher for the remainder of the dyno run. You can see that the horsepower and torque lines on the overlay chart cross at 4,400 rpm. The line-by-line rpm comparison also backs this up. Raising the performance level to a higher engine speed would be beneficial to most engines with enhanced performance.
On the negative side, converter C had the largest rise in temperature of any converter tested to this time (see Figure 3).
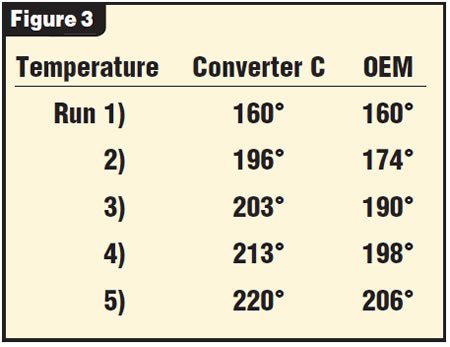
This trade-off is significant and would limit this modification to 1/8-and 1/4-mile performance applications. This modification also usually requires some form of additional cooling.
As you can see with converter C, some of the trade-offs are more significant than others. Consider the intended use of the vehicle and how a trade-off may affect or limit its use. You want your customer to be happy.
Next month: Replacing the OEM stator with the 145K-factor stator.
Special thanks to Sean Boyle and students Zack Emberto, Ross Rohlman and Luke Davis at Southern Illinois University for their technical assistance with this article.

Ed Lee is a Sonnax Technical Specialist who writes on issues of interest to torque converter rebuilders. Sonnax supports the Torque Converter Rebuilders Association. Learn more about the group at www.tcraonline.com. ©2007 Sonnax Industries Inc.