One way of looking at the survey information is to create a composite shop, one that represents the mean average of all the information gathered for certain categories. In creating this composite, we look at self-described transmission specialty shops and general repair shops that perform transmission and related work. As we’ve concentrated more on specialty transmission shops over the past couple of years, the percentage of those in our subscriber base has increased.
| Transmission Specialty | General Repair | |
| As a % of Transmission Digest Shop Subscribers: | 69% | 31% |
| Composite Shop | ||
| Monthly Car Count | 49.60 | 140.00 |
| Active Owners | 1.09 | 1.14 |
| Monthly Powertrain Car Count | 22.80 | 8.12 |
| Facility Managers | 0.29 | 0.57 |
| Transmission Rebuilders | 0.82 | 0.59 |
| Transmission Installers | 1.16 | 1.48 |
| Other Technicians/Mechanics | 0.22 | 1.71 |
| Office Employees | 0.38 | 0.60 |
| Total Employees Who: | ||
| Rebuild | 1.70 | 1.00 |
| Diagnose | 1.75 | 1.43 |
| Read Transmission Digest | 2.00 | 1.90 |
| Shop Rebuild Volume Avg. Month | ||
| Automatic Rebuilds | 21.57 | 4.00 |
| Manual Rebuilds | 1.50 | 0.67 |
| CVT Rebuilds | 1.60 | 0.44 |
| DCT/Hybrid Rebuilds | 0.21 | 0.00 |
| Transfer Case | 2.38 | 0.94 |
| Differential | 1.62 | 1.22 |
| Shop R&R Volume Avg. Month | ||
| Automatic Transmission | 1.65 | 1.11 |
| Manual Transmission | 0.26 | 0.50 |
| CVT Transmission | 0.80 | 0.44 |
| DCT/Hybrid Transmission | 0.10 | 0.17 |
| Transfer Case | 0.30 | 0.35 |
| Differential | 1.25 | 0.40 |
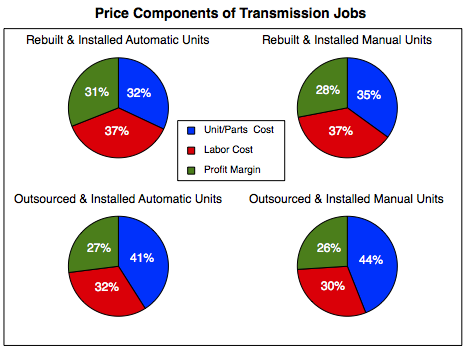
Labor + Parts + Profit = Price
This analysis is something important to know for any business. It’s worth noting that many retail shops strategize without considering the cost of materials and labor in an effort to match the predominant local price for a particular rebuilt or R&R-installed unit. This traditional approach of matching another facility’s price often results in adjusting the job’s profit component in order to reach the price point. Looking at all three of these components gives that shop a chance to explore cost constraints in an effort to achieve profitability relating to a particular group of jobs.
2021 State of The Powertrain Industry Methodology:
The Transmission Digest Annual Survey of Retail Shops has served as a benchmark and planning tool for the industry now for the past 35 years. Charts and tables in this section are based on a survey that was conducted early this year.
Where differences are obvious, we separate the responses of transmission specialty shops from general repair shops that perform powertrain work in an attempt to create a more accurate picture of the information.
Conversely, when we depict more general information concerning the industry as represented by readership of the magazine, we combine the segments of transmission specialty and general repair shops. In most cases, the information is the result of calculating an arithmetic (or weighted arithmetic) mean of the answers we received.
In the past year we have concentrated on focusing our subscriber base on shops performing transmission work on a “regular” basis. Thus, the percentage of transmission specialty shops compared to general repair shops that do transmission work has increased.
We are happy to share our information with anyone who is interested.
The share of self-described general repair facilities that perform transmission work has been expanding for many years: this year we find 61% of the responding readers consider their shop to be a transmission specialty facility; 39% check off as general repair.
Rebuild it, Perform an R&R or Refer the Job Away?
In this series of charts we report on transmission work Transmission Digest subscriber shops perform. For each transmission family depicted the shop was asked if most usually that unit was rebuilt in-house, replaced with an outsourced reman unit or if the job was referred to another shop.
We weighted the responses by the average monthly transmission jobs reported by each shop –A shop that works 100 transmission jobs a month is counted more heavily than the shop that handles one a week.
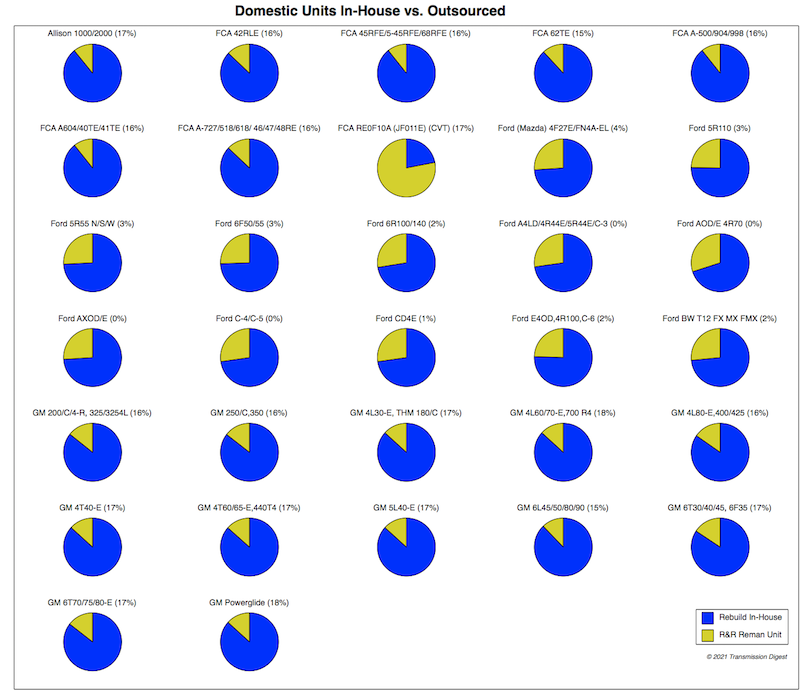
Because referrals end up in another shop represented in the survey, the pie charts show only the ratio of in-house rebuilt vs. outsourced reman units. The figures for percentage of referred jobs are in parenthesis next to the unit name. Historically, the rate of referral varies quite a bit from one year to the next based on the shop habits of responding subscribers.
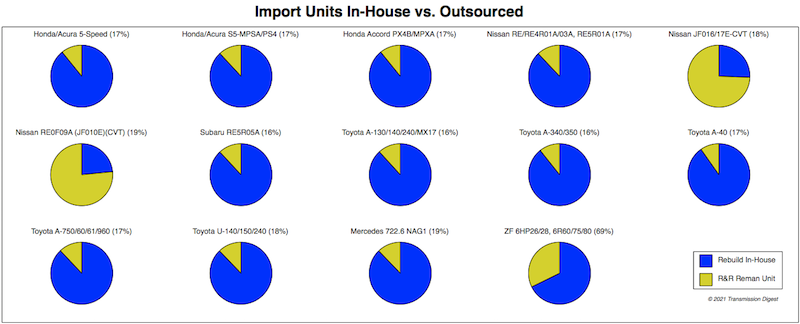
Finally, the studied families of transmissions are based on kit sales. This year’s survey finds that 46 units/families make up roughly 96% of kit sales.
Look At What We Do
There aren’t many measurements that impress the Transmission Digest publishers more than a look at the total number of automotive jobs performed by our readership. Nowhere is the responsibility to maintain a widely varied and cutting-edge content emphasized more strongly to us.
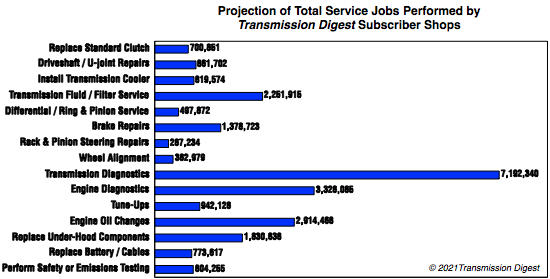
The projected numbers of annual jobs were calculated by taking the average number of jobs for each category as reported by shops responding to the survey, multiplying by the number of retail shop recipients of the magazine and then multiplying by 12 to convert the monthly figure gathered in the survey question into annual projected jobs.
To explain some fluctuation from prior years, the total number of retail shops includes some that have not signed up for a subscription. Because they are on business lists of potential subscribers they receive three or four issues of the magazine during the year and were included in the survey population. Many of these self-identify as general repair facilities.
The Industry’s Most Serviced Units
For the Survey we updated the list of most often seen transmissions and/or transmission families. There are 45 of these (based on distributor kit sales). This is an imperfect indicator as the reman factories often use kits specifically formulated for their operations as opposed to the distributor kits used for on-site rebuilding.
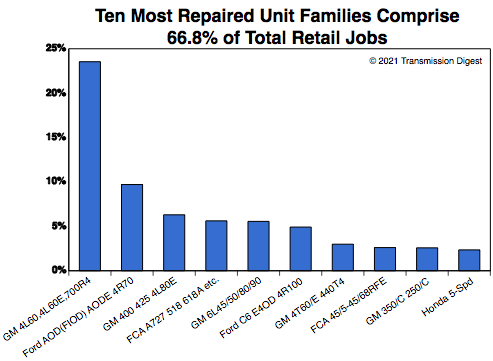
We approximate that these units make up just about 96% of the transmission jobs coming to the aftermarket. The 10 most often seen units accounted 66.8% of all the work showing up in retail bays while the next 36 most popular units combined to add 28.5% of the total jobs.
There are more than 100 additional units that shops commonly repair as well.
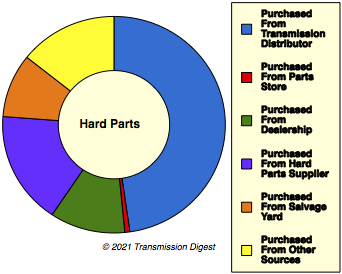
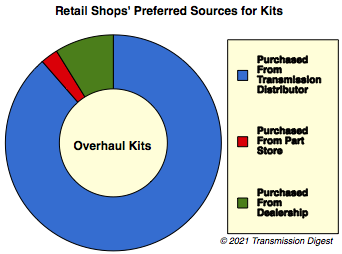
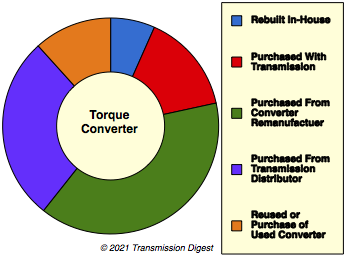
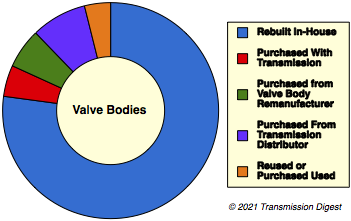
Build it vs. Buy it?
The survey identifies the percentage of units that shops installed used, rebuilt in-house as well as those that were outsourced. Outsourcing includes transmission units that are purchased from bench builders, automobile dealerships, aftermarket production rebuilders and parts distributors. The charts here assume that the decision of a supplier for outsourced units is based on price, warranty and perceived quality. Therefore we have combined all of the outsourced units into a single category for the graphic depictions.
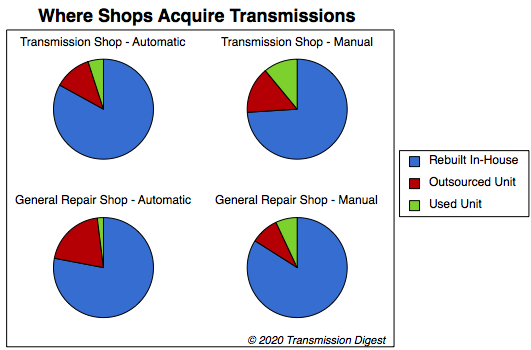
We have added a weighting factor based on each shop’s report of monthly transmission job volume to accurately portray the overall retail market’s use of the various source categories. Finally, what the pie charts depict is the proportion of various unit sources used by those shops that offer the particular service represented by the individual pies.